In my previous article capabilities of PHP code profiler XHprof from Facebook developers, namely installation, setting and usage were discussed.
The task today is to set a profiler for universal usage, looking like:
/mysite/page>?debug
So that one could use a profiler with the help of the same method for each page.We have achieved that. So this article covers this issue.
So,
0) we determine website development on which we want to profile and analyze web-application
1) we create domain <xhprof_domain>. We copy folders xhprof_html and xhprof_lib from original folder XHprof into domain directory.
2) we create xhprof_log folder in the root of domain.
3) we create xhprof.php file in the root of the domain with the following content:
 function my_xhprof_enable() {
  if (extension_loaded('xhprof')) {
    switch ($_GET['debug']) {
      case 'simple':
        define('DEBUG_MICROTIME_START', microtime(1));
        break;

      case 'all':
        xhprof_enable(XHPROF_FLAGS_CPU + XHPROF_FLAGS_MEMORY);
        break;

      case 'cpu':
        xhprof_enable(XHPROF_FLAGS_CPU);
        break;

      case 'memory':
        xhprof_enable(XHPROF_FLAGS_MEMORY);
        break;

      case 'time':
      default:
        xhprof_enable();
    }
  }
}

function my_xhprof_disable() {
  if ($_GET['debug'] == 'simple') {
    $time = number_format(microtime(1) - DEBUG_MICROTIME_START, 4);
    $cur  = number_format(memory_get_usage() / 1024, 3);
    $peak = number_format(memory_get_peak_usage() / 1024, 3);
    print "\ntime = {$time} seconds<br />\nmemory_get_usage = {$cur} kb<br />\nmemory_get_peak_usage = {$peak} kb";
  }
  elseif (extension_loaded('xhprof')) {
    include_once dirname(__FILE__) . '/xhprof_lib/utils/xhprof_lib.php';
    include_once dirname(__FILE__) . '/xhprof_lib/utils/xhprof_runs.php';
    $profiler_namespace = isset($_GET['namespace']) ? $_GET['namespace'] : $_SERVER['SERVER_NAME'];
    $xhprof_data = xhprof_disable();
    $xhprof_runs = new XHProfRuns_Default();
    $run_id = $xhprof_runs->save_run($xhprof_data, $profiler_namespace);

    $profiler_url = sprintf('<xhprof_domain>/xhprof_html/index.php?run=%s&source=%s', $run_id, $profiler_namespace);
    print '<script type="text/javascript">window.location.href=\''. $profiler_url .'\';</script>';
  }
}

if (isset($_GET['debug'])) {
  my_xhprof_enable();
  register_shutdown_function('my_xhprof_disable');
}
4) We edit the lines a little bit in php.ini, not forgetting to restart web-server after that:
extension=xhprof.so
xhprof.output_dir=/path/to/your/<xhprof-domain>/on/server/xhprof_log
auto_prepend_file=/path/to/your/<xhprof-domain>/on/server/xhprof.php
5) Enjoy it!
On any page of any domain we add GET-parameter «?debug» into address line (or ?debug=time, or ?debug=memory, or ?debug=cpu, or ?debug=all) and watch the result :)
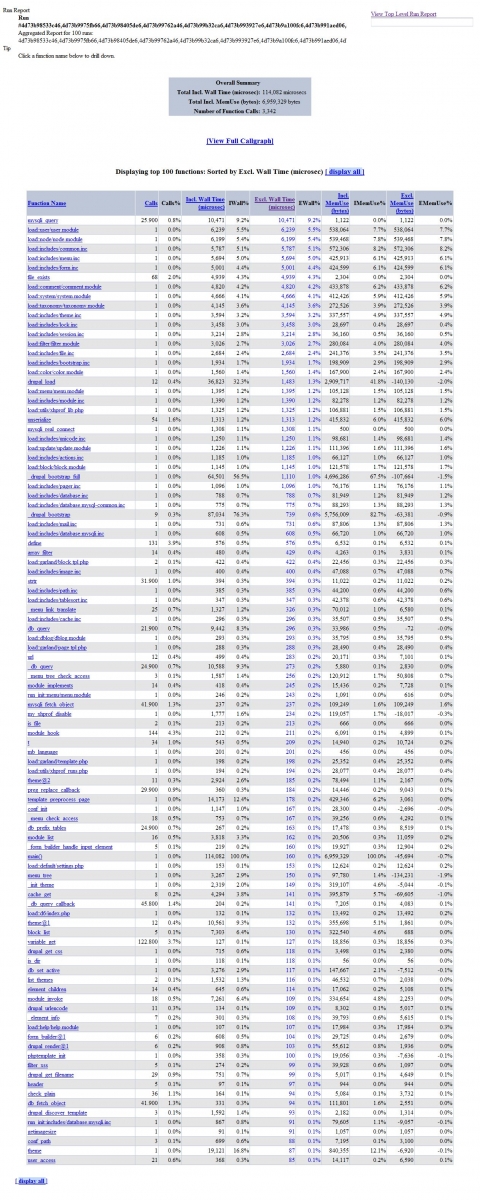 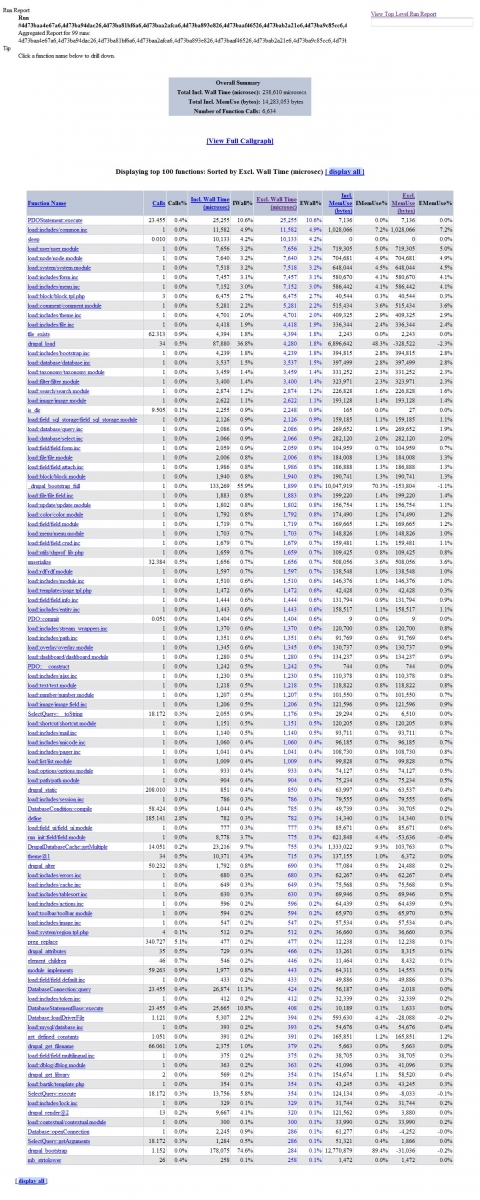 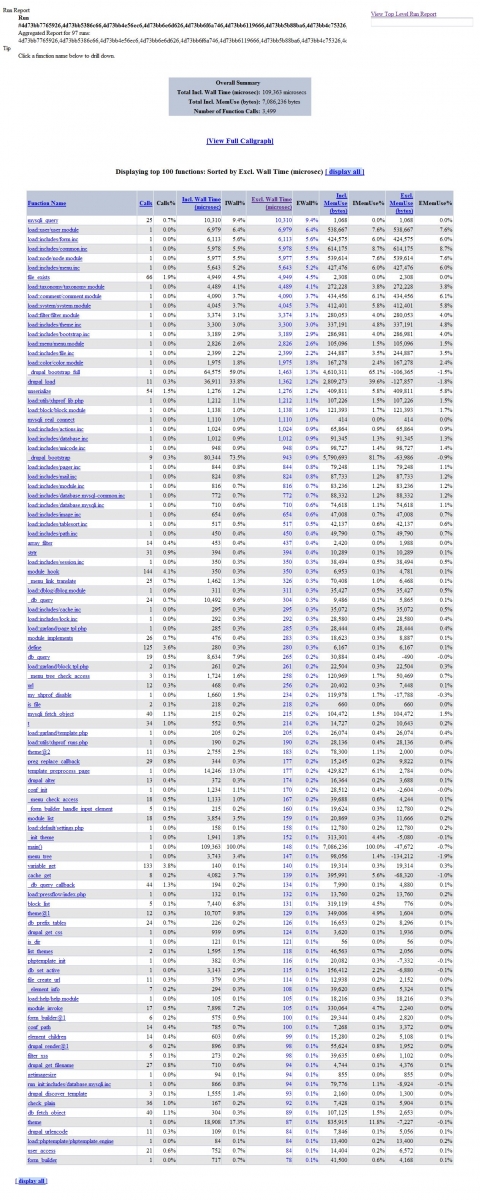 | 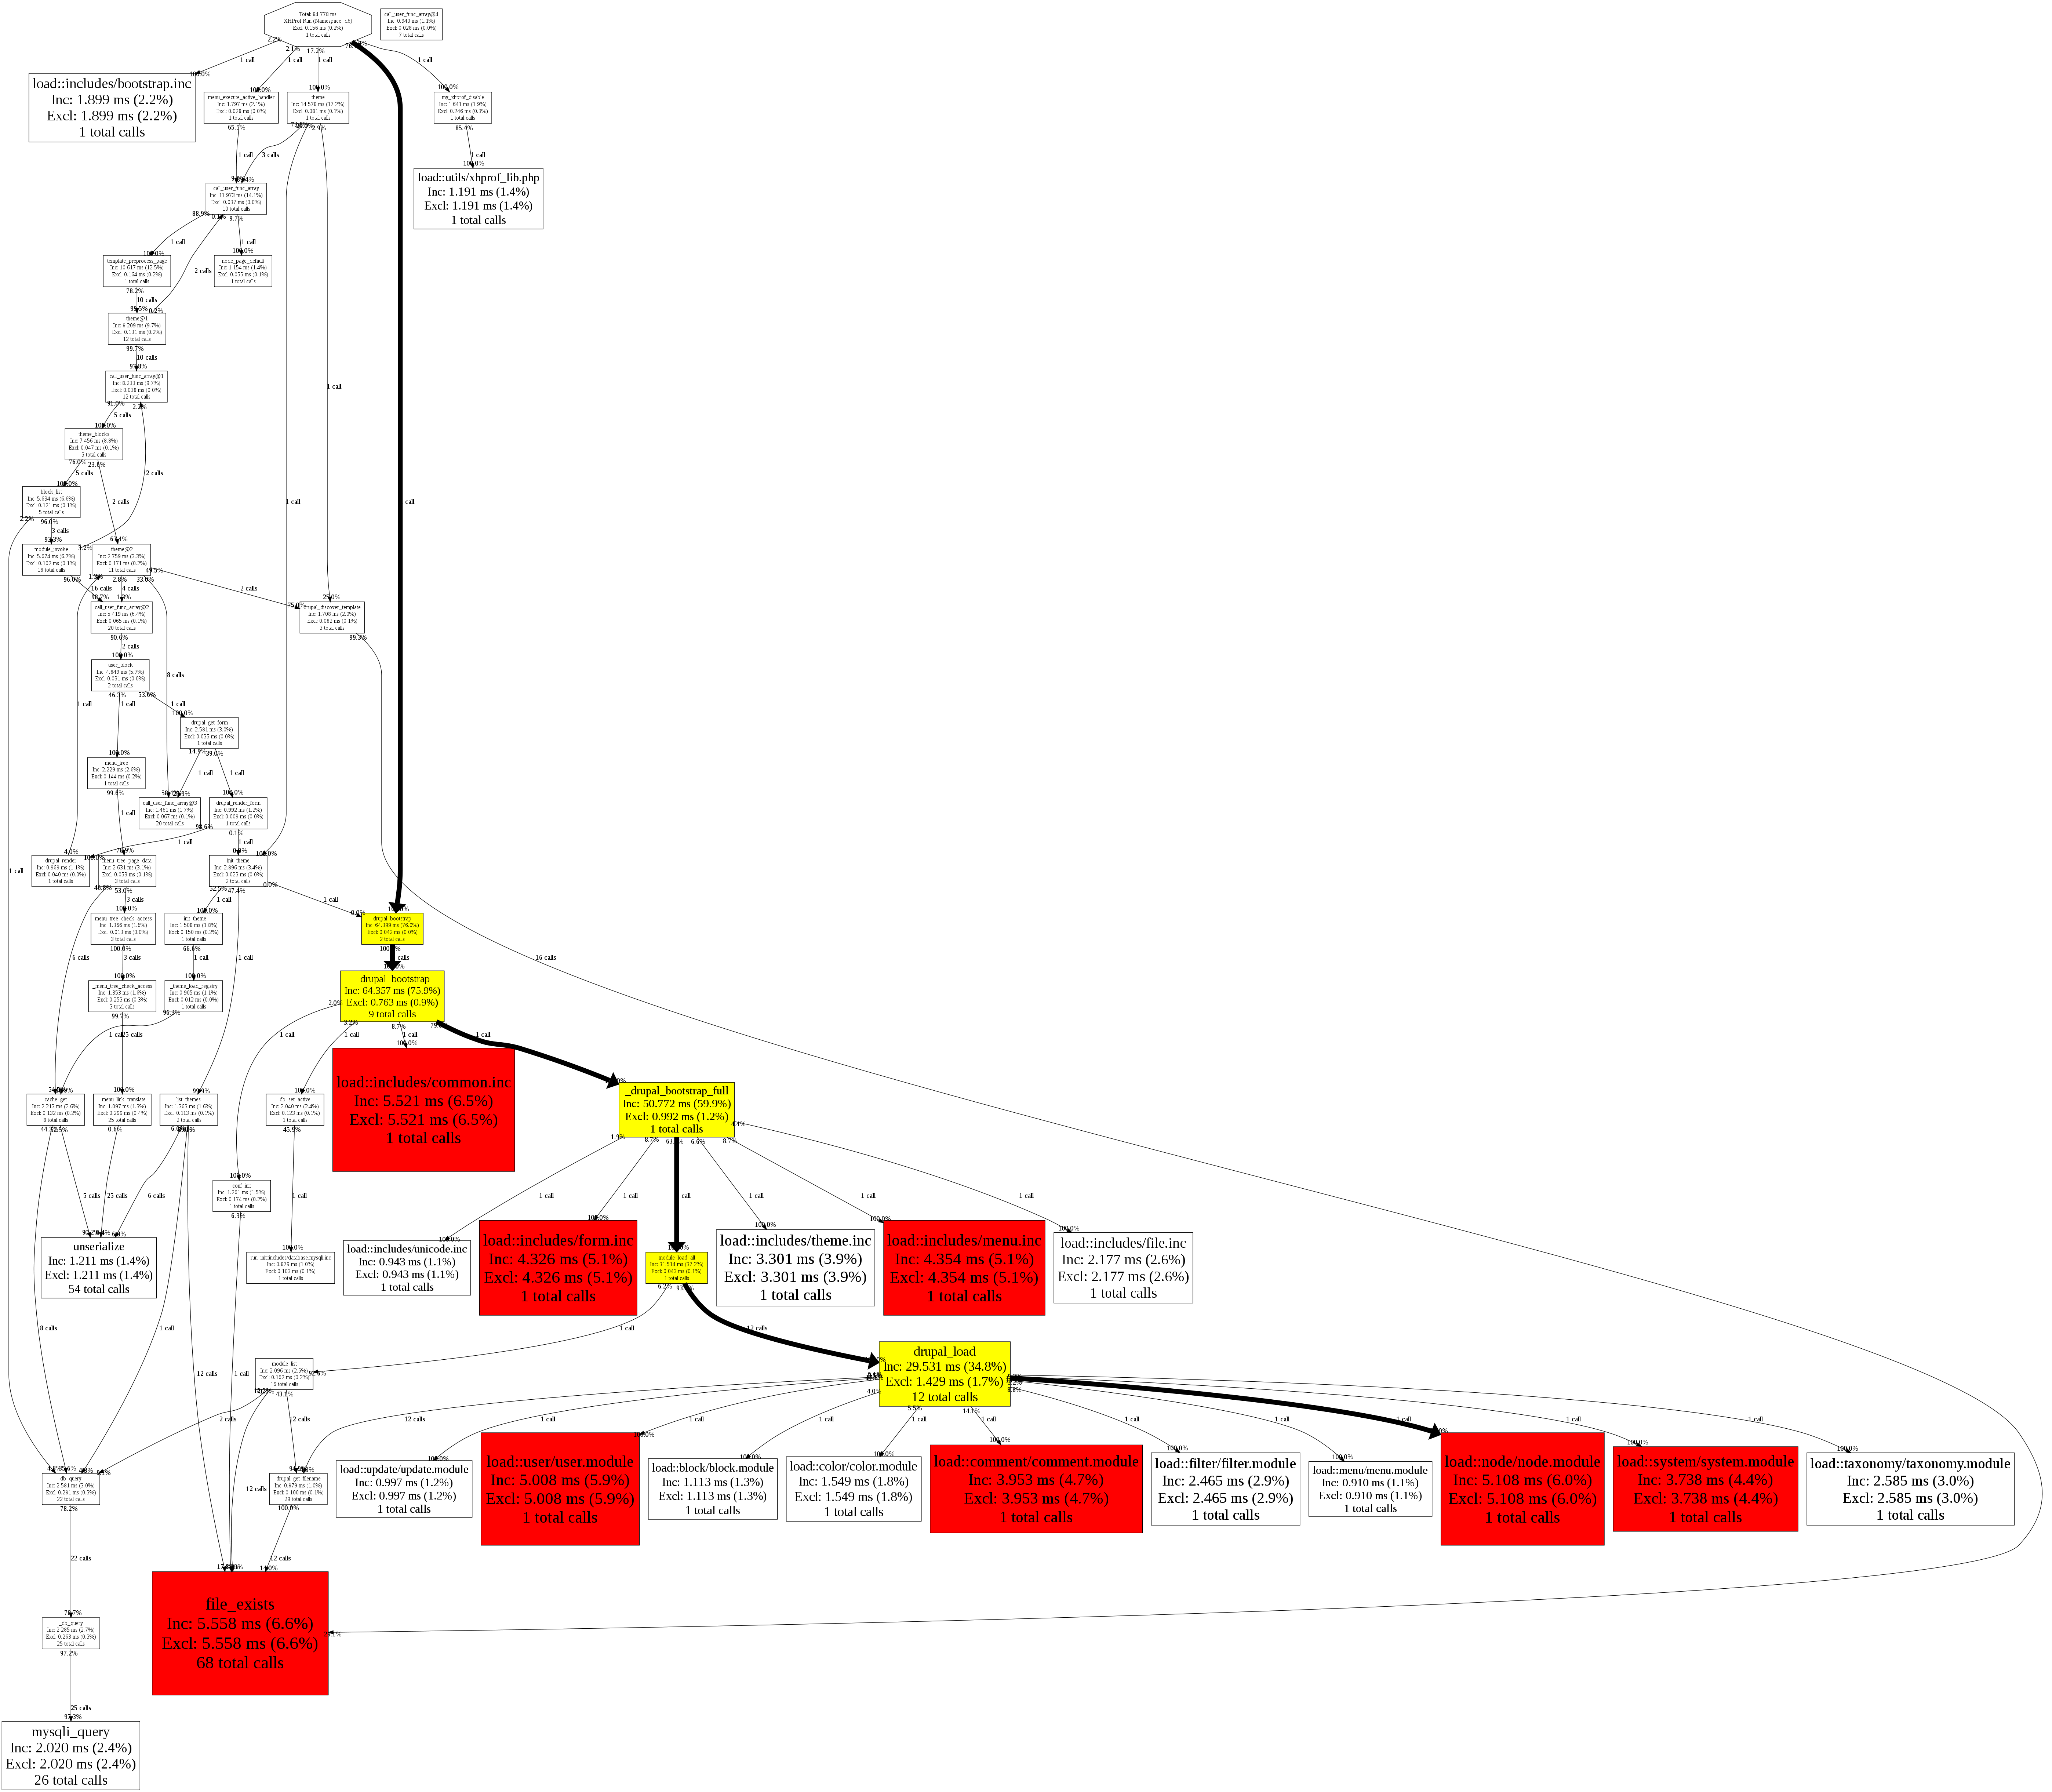  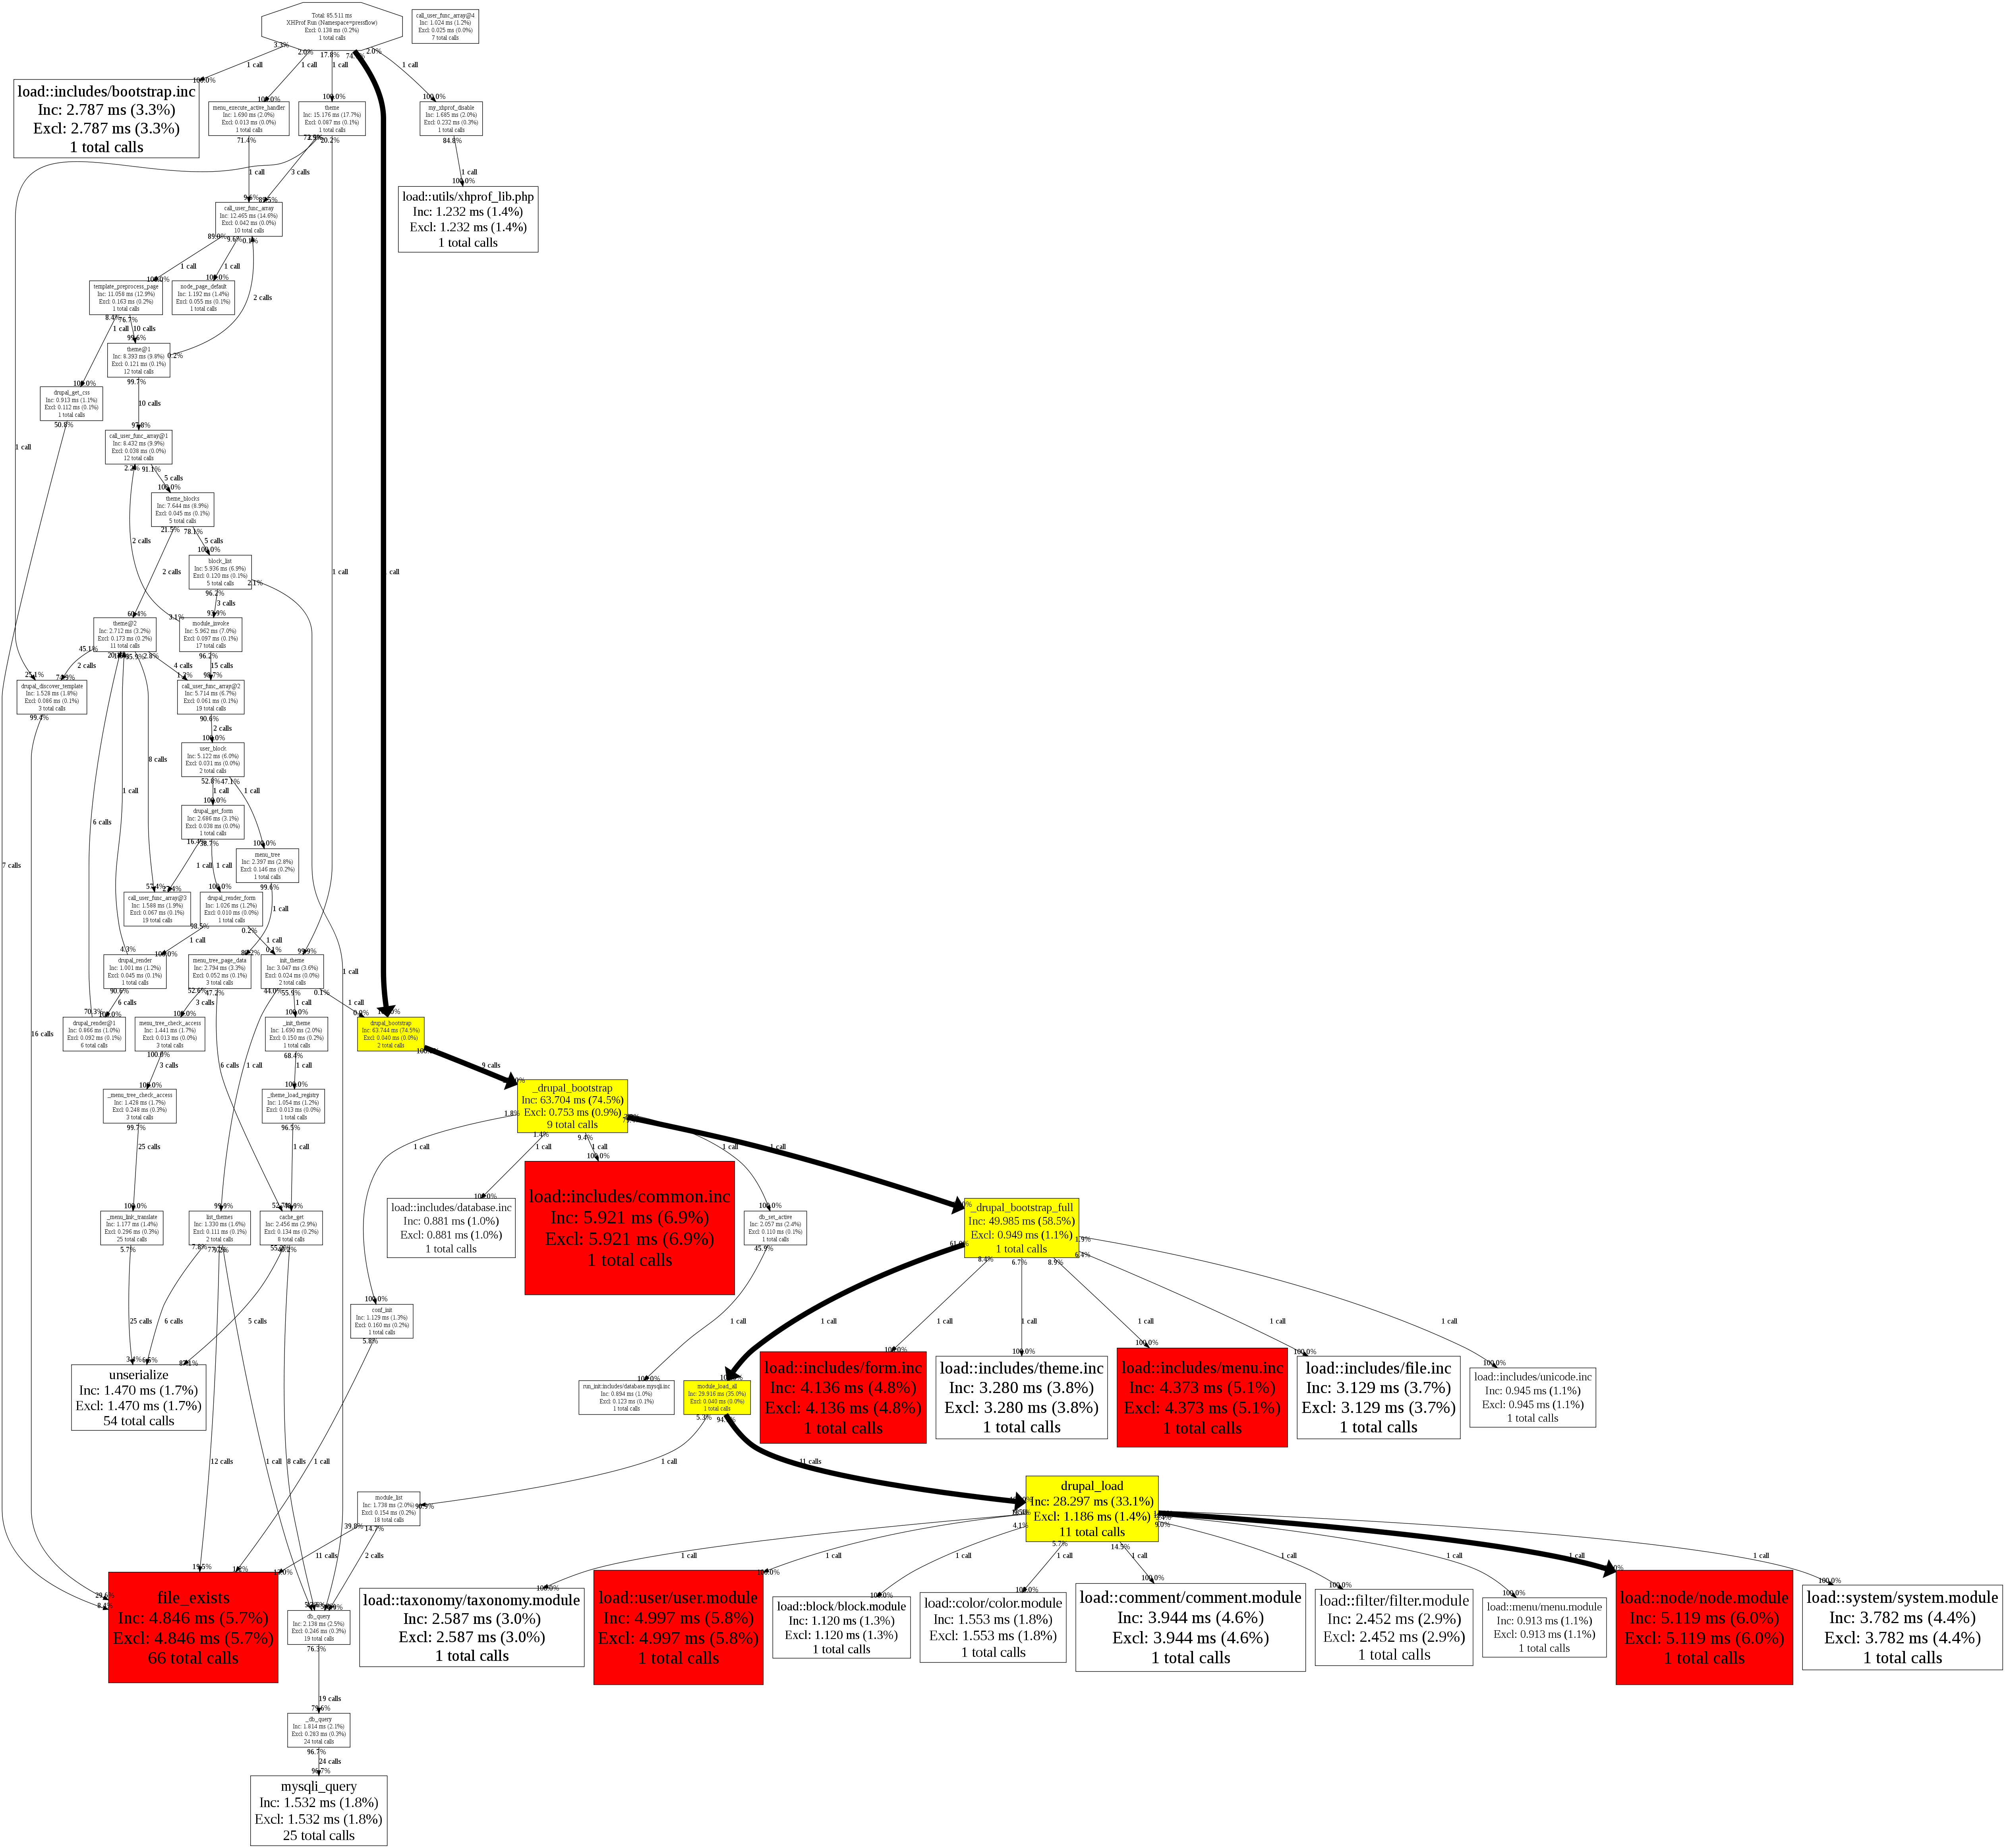 |
We must take into consideration the fact that during exhaustive usage of XHprof the time of page generation increases by about 2.5-4.5 ms, that’s why data don’t correspond to the reality. For example, on pages where generation time is very short; we have to understand that there is a range of inaccuracy between 2.5-4.5 to be taken into account. Sometimes it’s important.
In this case we use simplified mode “?debug=simple”. Now XHprof doesn’t connect at all, and we see the system output of real data about resources in simplified version at the bottom of the page.
time = 0.0020 seconds
memory_get_usage = 143.156 kb
memory_get_peak_usage = 183.211 kb
