The reports mentioned below have no particular practical value for web development because in real-life (modules installed, content created, users registration etc.) results are supposed to be completely different. That's why the given article is just an apt illustration of a profiler's real work ...
To demonstrate this, I have installed 3 versions of CMF Drupal:
1) Drupal 6.20
2) Drupal 7.0
3) Pressflow 6.20.97
Then I launched the web server benchmark with the help of siege utility, thrice:
root@server:/# siege 'http://xhprof.mysite.com/d6/?enable_xhprof=time&namespace=d6' -d10 -r10 -c10
root@server:/# siege 'http://xhprof.mysite.com/d7/?enable_xhprof=time&namespace=d7' -d10 -r10 -c10
root@server:/# siege 'http://xhprof.mysite.com/pressflow/?enable_xhprof=time&namespace=pressflow' -d10 -r10 -c10
10 times of 10 compatible queries for each installation with interval of 1-10 sec in between.
In order to see the average data of all the three XHprof launches, we'll create total.php file in the directory of our html-interface that will parse identifications of launches and will redirect us to the actual average report:
php
if (!$_GET['namespace']) {
  exit('there is no namespace in $_GET parameter.');
}

$namespace = (string)$_GET['namespace'];
$path = ini_get('xhprof.output_dir');
$dir  = dir($path);
$pattern = "/^([0-9a-z]{13})\.{$namespace}$/i";
while ($file = $dir->read()) {
  if (preg_match($pattern, $file, $matches)) {
    $files[] = $matches[1];
  }
}

header(sprintf('Location: /xhprof_html?source=%s&run=%s', $namespace, implode(',', (array)$files)));
Now, when we go to <xhprof_domain>/total.php?namespace=<name> we'll be given information about all XHprof launches for the specific namespace.
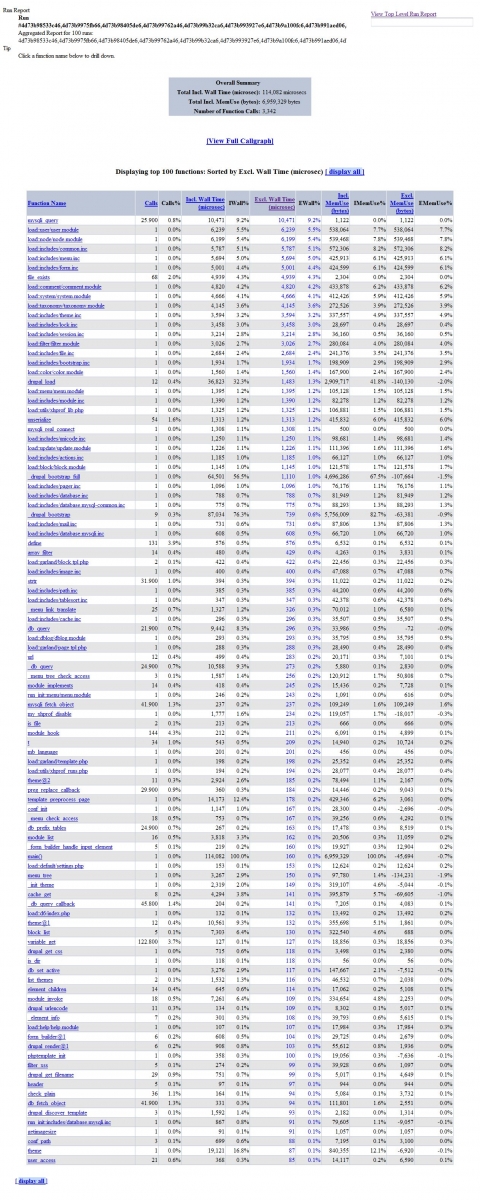
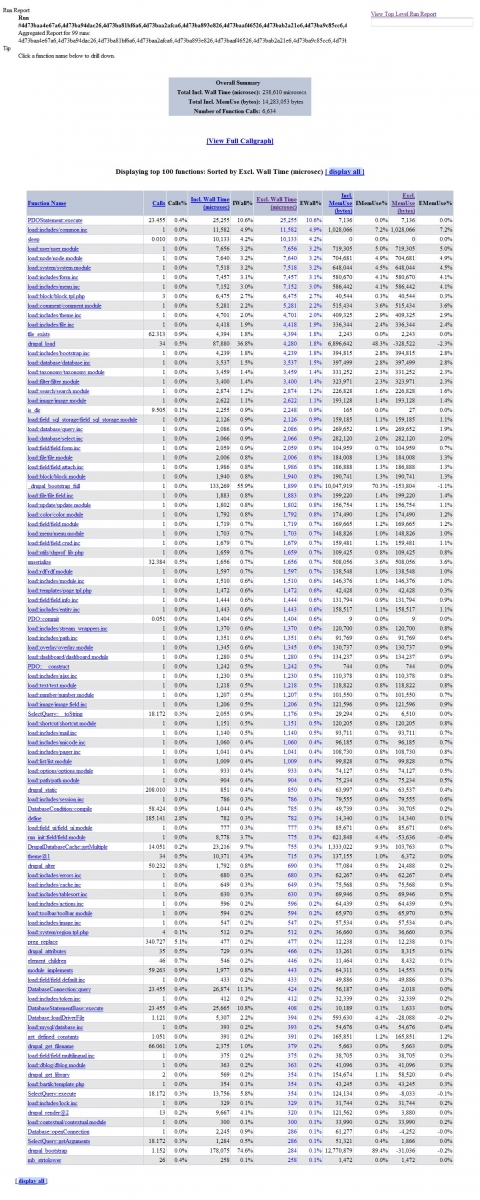
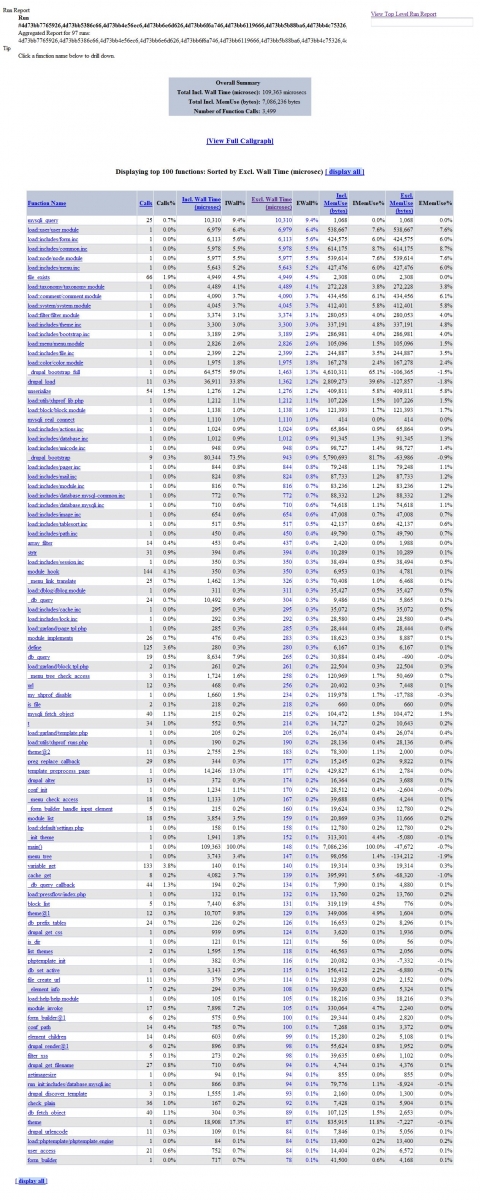
We've got the following results in our test (clickable):
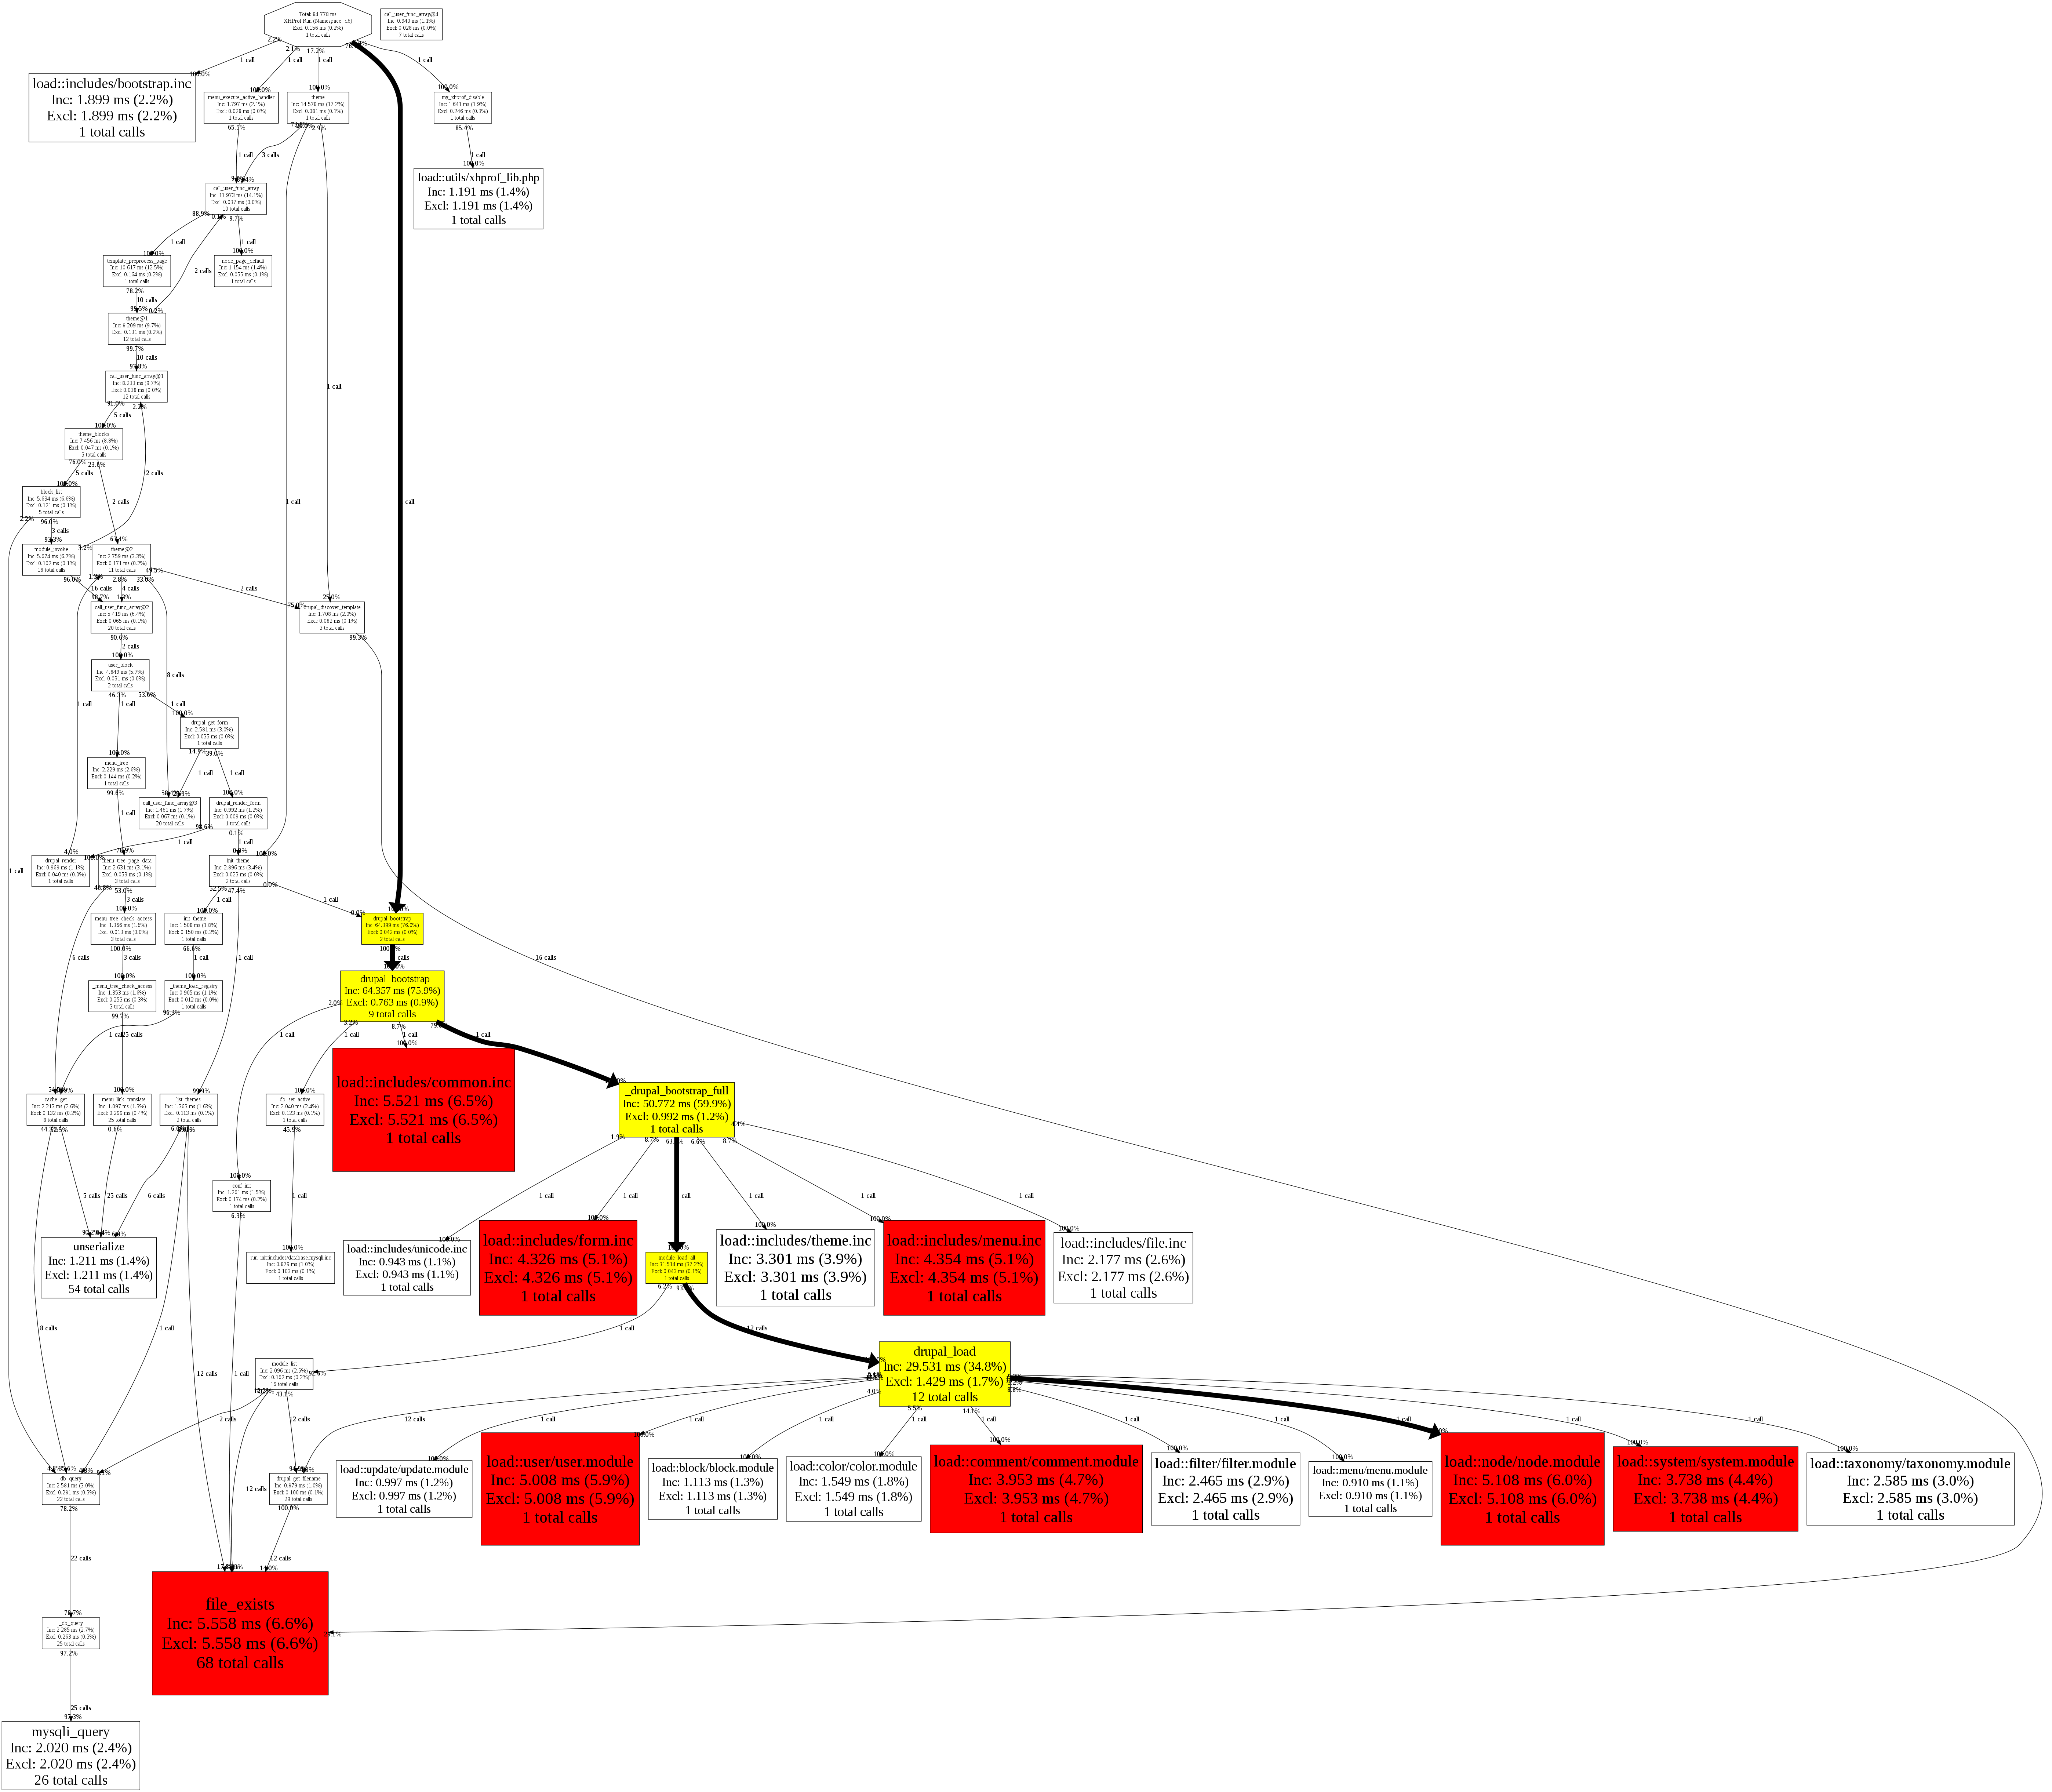
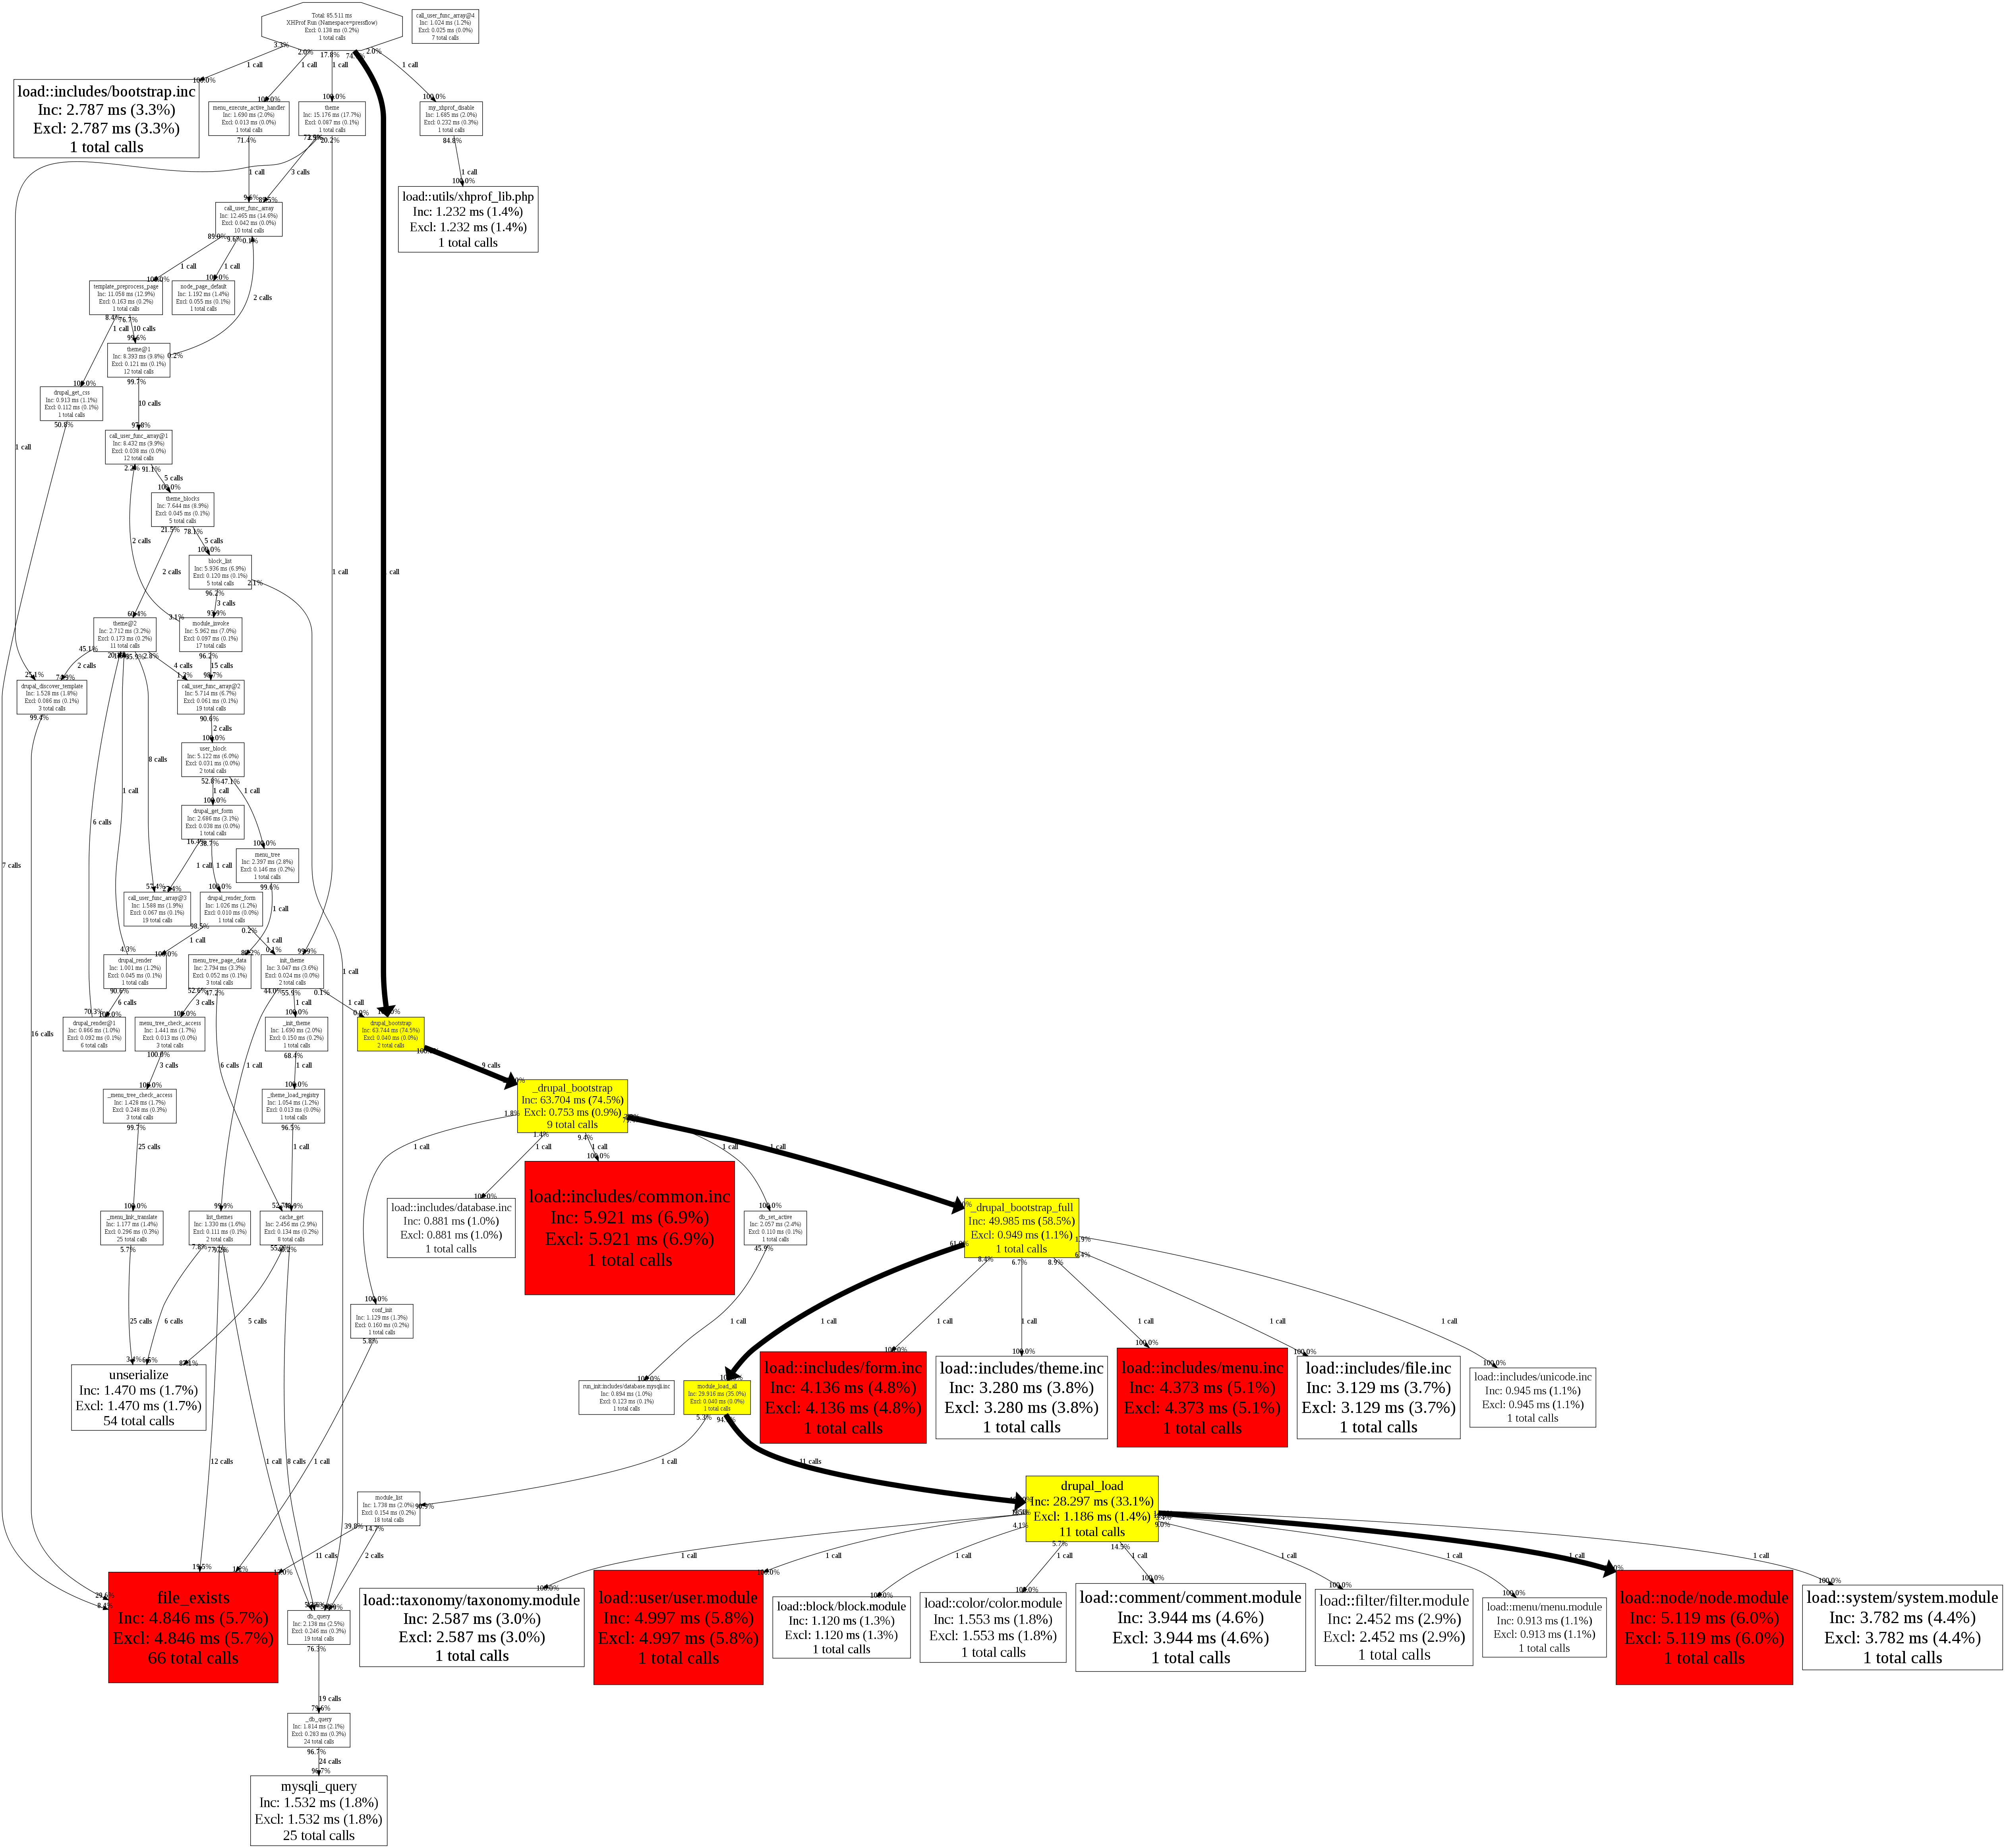
Screeshots (clickable) of graphic interface are given below. The whole thing looks very complicated yet unlikely to render any practical use, but it looks nice, like an insight into the inner scheme of Drupal work =)
It's better to use the data of graphic interface in case of profiling of small part of code.
Summary
As we see Pressflow showed the best results (average time of page generation is 109 milliseconds), on the second place almost without breakaway is Drupal 6.20 (114 milliseconds), and on the far third place is Drupal 7.0 (238 msec).
Though in reality, Pressflow will show much better results in comparison with basic Drupal.
Another interesting point is that there are no "critical" points in Drupal 7.0 (i.e. red elements are absent).
And yes, the experiment was repeated three times on different servers and Drupal 7 was behind with more than double breakaway...
