Let us give a brief outline of the library to be going with.
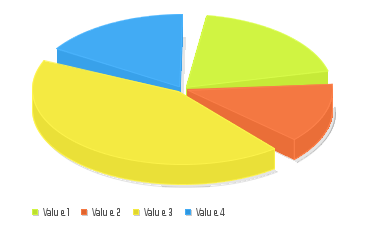
pChart is a set of classes that were designed by web developers for plotting charts, diagrams, etc. on PHP. For more specific information on this library, you can refer to http://www.pchart.net web-site. In fact, the results achievable with the use of pChart can be striking, e.g.:
So as to insure proper functioning of the pChart you will have to have the additional library for PHP installed on your server. For this, the following set of commands can be run
for Linux-systems:
sudo apt-get install php5-gd
sudo /etc/init.d/apache2 restart
for Windows, you will have to comment the bar in php.ini:
;extension=php_gd2.dll
After that, you'll need to restart the Apache server.
The pChart library can be downloaded from here.
Now it is time to look at how the library works with Drupal 7. There is a module (of the same name) pChart accessible on drupal.org web-site which you can make use of. As it is specified in its documentation, the only thing it does on its own is creating the basic wrapper for pChart integration with Drupal. Thus, we can easily do without it.
First, the pChart folder needs to be created in sites/all/libraries directory, with all library files eventually pasted into it. After that, we will announce the page our of chart's location:
/**
 * Implements hook_menu().
 */
function internetdevels_menu() {
  $items = array();
  $items['pchart'] = array(
    'page callback' => 'drupal_get_form',
    'page arguments' => array('internetdevels_pchart_form'),
    'access callback' => TRUE,
    'type' => MENU_CALLBACK,
  );
  return $items;
}
Now let's make a form for the data input and the button for chart plotting. We'll make use of AJAX, thus skipping the necessity to refresh the page when the chart will be plotted.
/**
* Form for input values to create schedule.
*/
function internetdevels_pchart_form($form, &$form_state) {
$form = array();
// Item for return schedule.
$form['replace_textfield'] = array(
'#markup' => '<div id="pchart_ajax"></div>',
);
$form['first_values'] = array(
'#type' => 'textfield',
'#title' => t('Enter values for first schedule'),
'#size' => 60,
'#maxlength' => 128,
'#required' => TRUE,
'#description' => t('For fractional numbers use sign ".". Use the sign ";" to separate digits.'),
);
$form['second_values'] = array(
'#type' => 'textfield',
'#title' => t('Enter values for second schedule'),
'#required' => TRUE,
'#description' => t('For fractional numbers use sign ".". Use the sign ";" to separate digits.'),
);
$form['confirm'] = array(
'#type' => 'submit',
'#value' => 'show schedule',
'#ajax' => array(
'callback' => 'internetdevels_pchart_ajax_callback',
'wrapper' => 'pchart_ajax',
'effect' => 'fade',
),
);
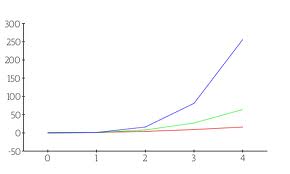
return $form;
}Here is the chart as having been plotted with the help of input data:
/**
 * Construction schedule to the entered value.
 */
function internetdevels_pchart_ajax_callback($form, &$form_state) {
  // Create an array of values.
  $first_values  = explode(";", $form_state['input']['first_values']);
  $second_values = explode(";", $form_state['input']['second_values']);

  // Include required files with pChart library.
  $name = "pChart";
  if ($path = libraries_get_path($name)) {
    include("{$path}/class/pData.class.php");
    include("{$path}/class/pDraw.class.php");
    include("{$path}/class/pImage.class.php");
  }

  // Create and populate the pData object.
  $myData = new pData();

  // Build your data series.
  $myData->addPoints($first_values, 'first');
  $myData->addPoints($second_values, 'second');

  // Draw series with specified weight.
  $myData->setSerieWeight("first", 2);
  $myData->setSerieWeight("second", 2);

  // Create a pChart object.
  $myPicture = new pImage(700, 210, $myData);

  // Rectangular gradient area.
  $myPicture->drawGradientArea(0, 0, 700, 230, DIRECTION_VERTICAL, array("StartR" => 075, "StartG" => 0, "StartB" => 0, "EndR" => 50, "EndG" => 50, "EndB" => 50, "Alpha" => 80));

  // Font and background of the schedule.
  $myPicture->setFontProperties(array("FontName" => "{$path}/fonts/Forgotte.ttf", "FontSize" => 11));
  $myPicture->setGraphArea(20, 10, 700, 190);

  // Draw scale, spline chart and legend of the schedule.
  $myPicture->drawScale();
  $myPicture->drawSplineChart();
  $myPicture->drawLegend(600, 12, array("Style" => LEGEND_NOBORDER, "Mode" => LEGEND_HORIZONTAL));

  // Creates a full file path from a directory and filename for render and view picture.
  $output = file_create_filename('example.png', 'sites/default/files/pictures');
  $myPicture->Render($output);
  return '<div id="pchart_ajax"><img src="' . file_create_url($output) . '" /></div>';
}
All values being entered and the chart plotting button pushed, the screen looks as follows:
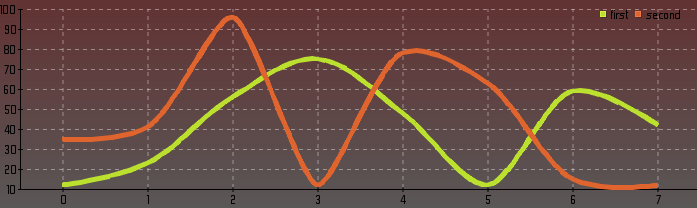
Here is another instance of chart plotting, performed with the use of set values:
/**
 * Construction schedule to the entered value.
 */
function internetdevels_pchart_ajax_callback($form, &$form_state) {
  $first_values = explode(";", $form_state['input']['first_values']);
  $second_values = explode(";", $form_state['input']['second_values']);
  $name = "pChart";
  if ($path = libraries_get_path($name)) {
    include("{$path}/class/pData.class.php");
    include("{$path}/class/pDraw.class.php");
    include("{$path}/class/pImage.class.php");
  }

  // Create and populate the pData object.
  $myData = new pData();
  $myData->addPoints($first_values, "First value");
  $myData->addPoints($second_values, "Second value");
  $myData->addPoints(array('Monday', 'Tuesday', 'Wednesday', 'Thursday', 'Friday', 'Saturday', 'Sunday'), "Day");

  // Add a description to one serie.
  $myData->setSerieDescription("Days", "Day");

  // Define the abscissa axis labels serie.
  $myData->setAbscissa("Day");
  $myPicture = new pImage(700, 230, $myData);
  $myPicture->setFontProperties(array("FontName" => "{$path}/fonts/Forgotte.ttf", "FontSize" => 11));
  $myPicture->setGraphArea(50, 30, 680, 200);  $myPicture->drawGradientArea(0, 0, 700, 230, DIRECTION_VERTICAL, array("StartR" => 075, "StartG" => 0, "StartB" => 0, "EndR" => 50, "EndG" => 50, "EndB" => 50, "Alpha" => 80));
  $myPicture->drawScale(array("CycleBackground" => TRUE, "DrawSubTicks" => TRUE, "GridR" => 185, "GridG" => 240, "GridB" => 120, "GridAlpha" => 10));
  $settings = array("Gradient" => TRUE, "GradientMode" => GRADIENT_EFFECT_CAN);

  // Draw a bar chart.
  $myPicture->drawBarChart($settings);
  $myPicture->drawLegend(540, 12, array("Style" => LEGEND_NOBORDER, "Mode" => LEGEND_HORIZONTAL));
  $output = file_create_filename('example.png', 'sites/default/files/pictures');
  $myPicture->Render($output);
  return '<div id="pchart_ajax"><img src="' . file_create_url($output) . '" /></div>';
}
The ultimate result looks as follows: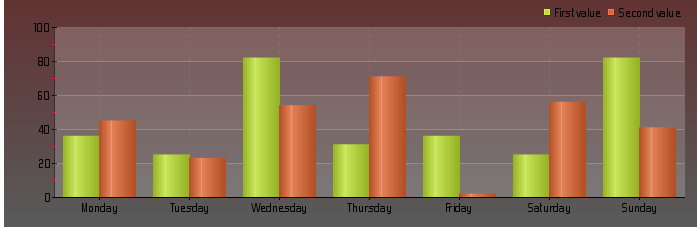 As you can see, pChart library is a very useful tool which is capable of plotting charts of all complexity levels; and its methods are quite explicit and easy to understand.
More information:
1) http://www.pchart.net/download
2) http://wiki.pchart.net
3) https://www.drupal.org/project/pchart