It is common knowledge that Google Analytics (hereinafter GA) is a powerful tool for collecting data about user activity on your site - the relevant statistics is available at GA site. But sometimes web developer needs to manipulate (to collect, analyze, build graphs) the statistics on the side of the site. You can use Google Analytics PHP Interface (hereinafter GAPI). Its usage is the very question we are going to inquire into here, and also to construct a chart which will be based on the statistics, gathered with the help of Google Charts API.
As you know, statistics gathered by GA is only available online http://www.google.com/analytics/. But very often, GA standard functionality does not allow for collecting the statistics you want. To select statistics that best caters to your specific needs, you can access «Event Tracking».
Let’s imagine that we want to collect statistics on specific authors blogging on //internetdevels.com the one you are reviewing now. You need to insert into standard GA code (see below):
 var _gaq = _gaq || [];
  _gaq.push(['_setAccount', 'your_ga_key']);
  _gaq.push(['_trackPageview']);
   (function() {
    var ga = document.createElement('script'); ga.type = 'text/javascript'; ga.async = true;
    ga.src = ('https:' == document.location.protocol ? 'https://ssl' : 'http://www') + '.google-analytics.com/ga.js';
    var s = document.getElementsByTagName('script')[0]; s.parentNode.insertBefore(ga, s);
  })();
the following line:
_gaq.push(['_trackEvent', 'Blog author', '%username%', '%blog_title%']);
No need to explain that you should substitute the author’s name and the name of the blog on the PHP side on the page.tpl.php or hook_page_alter. Similarly, you can collect data download speeds, as it is described here.
So, let’s work more closely on the tracking events method.
_trackEvent(category, action, opt_label, opt_value, opt_noninteraction);
category (required) — the generalized name of the events you want to monitor. In our case, it's «Blog author»;
action (required) — the option by which we group events. In our case, it’s a nickname of the author;
label (optional) — an option that helps to create additional categorization of events. For this option, we use the name of the blog;
value (optional) — an integer that allows for passing additional information about the event. It doesn’t need to be used hereby;
non-interaction (optional) — a boolean parameter, which having being installed in TRUE, indicates that this event is supposed to be ignored as long as the failure statistics being calculated. No need to use it, either.You can get a closer look at the details related to tracking events here.
Next, you should download the GAPI, fill in the sites / default / libraries and create a module. Let’s name it «internetdevels_chart» and have a hook_menu announced in the module:
 /**
 * Implements hook_menu().
 */
function internetdevels_chart_menu() {
  $items['chart'] = array(
    'title'            => 'Blog posts Statistics',
    'page callback'    => 'drupal_get_form',
    'page arguments'    => array('internetdevels_chart_form'),
    'access callback'  => TRUE,
  );
  return $items;
}
Here's the generation function and the form processing of «internetdevels_chart_form» :
 /**
 * Generates chart form.
 */
function internetdevels_chart_form($form, $form_state) {
  $from = isset($_GET['from']) && preg_match('/[\d-]+/', $_GET['from']) ? $_GET['from'] : '2011-03-30';
  $to = isset($_GET['to']) && preg_match('/[\d-]+/', $_GET['to']) ? $_GET['to'] : format_date(REQUEST_TIME, 'custom', 'Y-m-d');
  $form['from'] = array(
    '#title' => t('From'),
    '#type' => 'date_popup',
    '#date_format' => 'd/m/Y',
    '#default_value' => $from,
  );
  $form['to'] = array(
    '#title' => t('To'),
    '#type' => 'date_popup',
    '#date_format' => 'd/m/Y',
    '#default_value' => $to,
  );
  $form['submit'] = array(
    '#type' => 'submit',
    '#value' => t('Submit'),
  );

  require_once 'sites/all/libraries/gapi/gapi.class.php';
  // We will display statistics only for active users.
  $q = db_query("SELECT name FROM {users} WHERE uid > 0 AND status = 1");
  $active_users = $authors = array();
  foreach ($q as $row) {
    $active_users[] = $row->name;
  }
  // Here you need to puy your google account credentials.
  $ga = new gapi('your_email','your_pass');
  // Your_profile_ID - the namespaced profile ID of the profile from which to request data.
  $ga->requestReportData('Your_profile_ID', array('eventCategory', 'eventAction'), array('totalEvents'), '-totalEvents', 'eventCategory==Blog author', $from, $to);
  $rows = array();
  foreach($ga->getResults() as $result) {
    $dimensions = $result->getDimesions();
    $metrics = $result->getMetrics();
    $rows[$dimensions['eventAction']] = $metrics['totalEvents'];
  }
  // Here I'm formatting results for correct displaying in chart.
  arsort($rows);
  $rows = array_filter($rows);
  foreach ($rows as $k => $v) {
    $authors[] = "['{$k}', $v]";
  }
  $tojs = implode(',', $authors);
  $out = theme('internetdevels_chart_graph', array('rows' => $tojs));
  $form['graph'] = array(
    '#type' => 'item',
    '#markup' => $out,
  );
  return $form;
}
/**
 * Validate handler for chart form.
 */
function internetdevels_chart_form_validate($form, &$form_state) {
  $fv = $form_state['values'];
  if (strtotime($fv['from']) > strtotime($fv['to'])) {
    form_set_error('from', t('From date cannot be greater then to date'));
  }
  if (strtotime($fv['to']) > REQUEST_TIME) {
    form_set_error('to', t('To date cannot be greater then current date'));
  }
}

/**
 * Submit handler for chart form.
 */
function internetdevels_chart_form_submit($form, &$form_state) {
  $fv = $form_state['values'];
  $query = array();
  if ($fv['from']) {
    $query['from'] = $fv['from'];
  }
  if ($fv['to']) {
    $query['to'] = $fv['to'];
  }
  $form_state['redirect'] = array(current_path(), array('query' => $query));
}
To facilitate the use of Google Charts API, declare hook_theme:
 /**
 * Implements of hook_theme().
 */
function internetdevels_chart_theme() {
  return array(
    'internetdevels_chart_graph' => array(
      'template' => 'internetdevels-chart-graph',
      'path' => drupal_get_path('module', 'internetdevels_chart')
    ),
  );
}
As you can see now, the result is being printed in
<script type="text/javascript" src="https://www.google.com/jsapi"></script>
<script type="text/javascript">

  // Load the Visualization API and the piechart package.
  google.load('visualization', '1.0', {'packages':['corechart']});

  // Set a callback to run when the Google Visualization API is loaded.
  google.setOnLoadCallback(drawChart);

  // Callback that creates and populates a data table,
  // instantiates the pie chart, passes in the data and
  // draws it.
  function drawChart() {

    // Create the data table.
    var data = new google.visualization.DataTable();
    data.addColumn('string', 'Topping');
    data.addColumn('number', 'Slices');
    data.addRows([
     <?php print $rows ?>
    ]);

    // Set chart options
    var options = {'width':1100,
                   'height':800,
                   'sliceVisibilityThreshold':1/999999,
                   'backgroundColor':'#F2F2F2'
                  };

    // Instantiate and draw our chart, passing in some options.
    var chart = new google.visualization.PieChart(document.getElementById('chart_div'));
    chart.draw(data, options);
  }
</script>
<div id="chart_div" style="text-align:center;"></div>
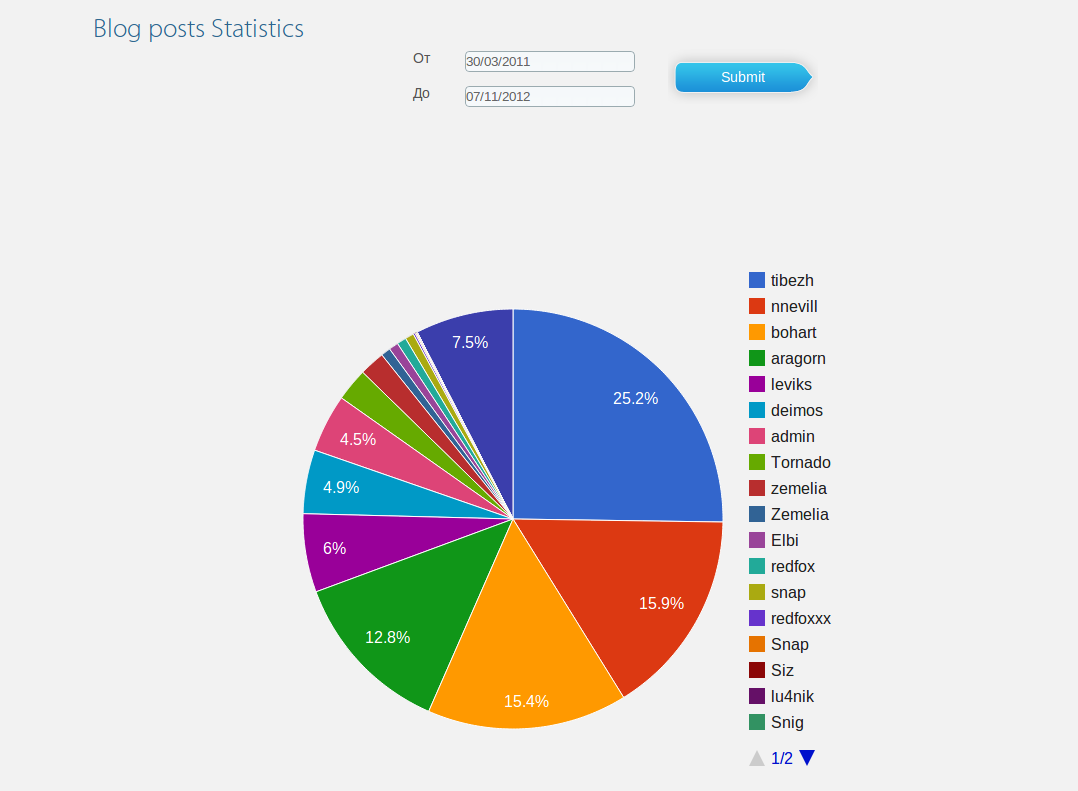
To get the results displayed, I used a Pie Chart. There is no point giving the verbose and detailed explanation for the above as even the housewife is going to get it right: you just need to copy the <nobrjs-code< nobr=""> and embed the parameters into the options array.
The eventual result is looking like this:
PS: There is a web interface to query the GA API — Google Analytics Query Explorer 2. This link is very useful in building web development queries.